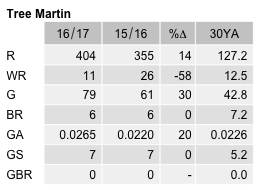
Tree Martin
Petrochelidon nigricans
ABR description
The following is extracted from the Annual Bird Report for the twelve months to June 2017.
Uncommon, breeding summer migrant
A regular summer woodland migrant.
General: Number of birds (2,744) more than last year (2,033) and much more than the 10YA (1,205) and the 30YA (855). Although a migratory species, some over-winter hence recorded in all months, with many more records in spring (35%) and summer (38%) than in autumn (9%) and winter (18%). Reporting rate (2.9%) similar to last year (3.0%) though lower than the 10YA (3.9%) and the 30YA (4.7%). Recorded from 25% of grid cells surveyed (last year 20%), a little above the 10 and 30YAs (both 19%). Max 125 (50 last year), mean 7.0, median 3. 7 widely distributed breeding records (6 last year), on a par with the 10YA (9.1) and the 30YA (7.2): first on/26 Oct Kama NR GrI13 (DaC2) and last ih/16 Nov Gigerline NR GrJ19 (CoF1).
GBS: Number of birds (68) like last year (64), the 10YA (63) and the 30YA (62). 15 records (14 last year), similar to the 10YA (14) and the 30YA (13), from 7 sites. Records from Sep, Oct and Dec to Apr. Reporting rate (0.6%) just above last year (0.5%) though more than the 10YA (0.4%) and the 30YA (0.5%). Abundance higher than last year and the 10YA (0.0197) and the 30YA (0.0226). No breeding ever recorded in the GBS.
Abundance
Abundance is the average number of birds of that species per survey. Where the species was observed (presence recorded) but the number of birds seen was not recorded, this is treated as a count of zero.
Abundance by year
This chart shows the abundance of Tree Martin between 1982 and 2017. 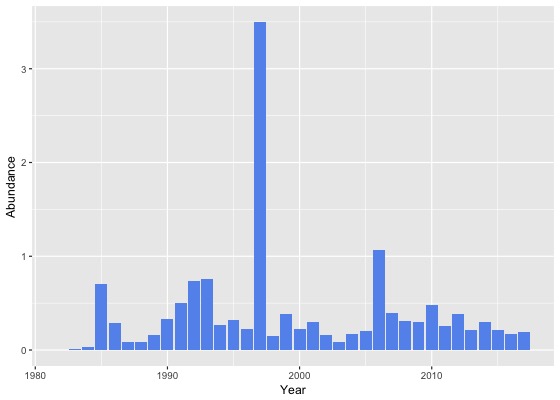
Abundance by month
This chart shows the monthly abundance of Tree Martin. The blue lines show the abundance for the twelve months to June 2017 and the bars show the average abundance for the period 1982 to 2017. 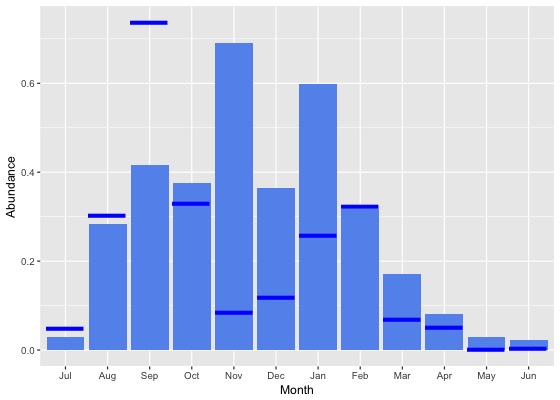
Abundance by season
This chart shows the seasonal abundance of Tree Martin. The blue lines show the seasonal abundance for the twelve months to June 2017 and the bars show the average seasonal abundance for the period 1982 to 2017. 
Abundance data
| Month | Season | ||||||||||||||||||
|---|---|---|---|---|---|---|---|---|---|---|---|---|---|---|---|---|---|---|---|
| Period | Jul | Aug | Sep | Oct | Nov | Dec | Jan | Feb | Mar | Apr | May | Jun | Winter | Spring | Summer | Autumn | All | ||
| All years | |||||||||||||||||||
| All | 0.0 | 0.3 | 0.4 | 0.4 | 0.7 | 0.4 | 0.6 | 0.3 | 0.2 | 0.1 | 0.0 | 0.0 | 0.1 | 0.5 | 0.4 | 0.1 | 0.3 | ||
| Previous years | |||||||||||||||||||
| All previous years | 0.0 | 0.3 | 0.4 | 0.4 | 0.8 | 0.4 | 0.7 | 0.3 | 0.2 | 0.1 | 0.0 | 0.0 | 0.1 | 0.5 | 0.5 | 0.1 | 0.3 | ||
| Previous 30 years | 0.0 | 0.3 | 0.4 | 0.4 | 0.8 | 0.4 | 0.7 | 0.3 | 0.2 | 0.1 | 0.0 | 0.0 | 0.1 | 0.5 | 0.5 | 0.1 | 0.3 | ||
| Previous 20 years | 0.0 | 0.3 | 0.4 | 0.4 | 1.0 | 0.4 | 0.7 | 0.3 | 0.2 | 0.1 | 0.0 | 0.0 | 0.1 | 0.5 | 0.5 | 0.1 | 0.3 | ||
| 10 year groups | |||||||||||||||||||
| [2007,2017) | 0.0 | 0.3 | 0.4 | 0.4 | 0.4 | 0.5 | 0.4 | 0.2 | 0.1 | 0.0 | 0.0 | 0.0 | 0.1 | 0.4 | 0.4 | 0.1 | 0.3 | ||
| [1997,2007) | 0.0 | 0.2 | 0.3 | 0.3 | 2.1 | 0.3 | 1.7 | 0.4 | 0.2 | 0.1 | 0.0 | 0.0 | 0.1 | 0.8 | 0.7 | 0.1 | 0.5 | ||
| [1987,1997) | 0.1 | 0.2 | 0.4 | 0.3 | 0.2 | 0.4 | 0.5 | 0.4 | 0.4 | 0.2 | 0.0 | 0.0 | 0.1 | 0.3 | 0.4 | 0.2 | 0.3 | ||
| 5 year groups | |||||||||||||||||||
| [2012,2017) | 0.0 | 0.4 | 0.3 | 0.3 | 0.5 | 0.4 | 0.4 | 0.2 | 0.1 | 0.0 | 0.0 | 0.0 | 0.1 | 0.4 | 0.3 | 0.1 | 0.2 | ||
| [2007,2012) | 0.0 | 0.3 | 0.6 | 0.6 | 0.4 | 0.6 | 0.5 | 0.3 | 0.2 | 0.1 | 0.1 | 0.0 | 0.1 | 0.5 | 0.5 | 0.1 | 0.3 | ||
| [2002,2007) | 0.0 | 0.1 | 0.3 | 0.3 | 0.2 | 0.3 | 2.8 | 0.4 | 0.1 | 0.0 | 0.0 | 0.0 | 0.0 | 0.3 | 1.1 | 0.1 | 0.4 | ||
| [1997,2002) | 0.0 | 0.3 | 0.3 | 0.4 | 4.3 | 0.4 | 0.4 | 0.4 | 0.3 | 0.2 | 0.0 | 0.1 | 0.1 | 1.5 | 0.4 | 0.2 | 0.6 | ||
| [1992,1997) | 0.0 | 0.3 | 1.0 | 0.4 | 0.3 | 0.7 | 0.8 | 0.7 | 0.6 | 0.4 | 0.0 | 0.0 | 0.1 | 0.5 | 0.7 | 0.4 | 0.4 | ||
| [1987,1992) | 0.1 | 0.2 | 0.2 | 0.3 | 0.2 | 0.2 | 0.3 | 0.3 | 0.2 | 0.1 | 0.0 | 0.0 | 0.1 | 0.2 | 0.3 | 0.1 | 0.2 | ||
| Year | |||||||||||||||||||
| 2017 | 0.0 | 0.3 | 0.7 | 0.3 | 0.1 | 0.1 | 0.3 | 0.3 | 0.1 | 0.1 | 0.0 | 0.0 | 0.1 | 0.4 | 0.2 | 0.0 | 0.2 | ||
| 2016 | 0.0 | 0.3 | 0.4 | 0.3 | 0.3 | 0.2 | 0.2 | 0.2 | 0.1 | 0.0 | 0.0 | 0.0 | 0.1 | 0.3 | 0.2 | 0.0 | 0.2 | ||
| 2015 | 0.0 | 0.2 | 0.2 | 0.4 | 0.2 | 0.3 | 0.6 | 0.2 | 0.1 | 0.0 | 0.0 | 0.0 | 0.1 | 0.3 | 0.4 | 0.0 | 0.2 | ||
| 2014 | 0.1 | 0.3 | 0.3 | 0.3 | 0.8 | 0.6 | 0.7 | 0.2 | 0.1 | 0.0 | 0.0 | 0.0 | 0.1 | 0.4 | 0.5 | 0.0 | 0.3 | ||
| 2013 | 0.0 | 0.3 | 0.2 | 0.3 | 0.6 | 0.4 | 0.2 | 0.0 | 0.1 | 0.0 | 0.0 | 0.0 | 0.1 | 0.4 | 0.2 | 0.1 | 0.2 | ||
| 2012 | 0.1 | 0.9 | 0.5 | 0.4 | 0.8 | 0.8 | 0.2 | 0.4 | 0.5 | 0.0 | 0.0 | 0.0 | 0.3 | 0.5 | 0.4 | 0.2 | 0.4 | ||
| 2011 | 0.1 | 0.1 | 0.2 | 0.5 | 0.2 | 0.3 | 0.2 | 0.4 | 0.4 | 0.3 | 0.0 | 0.0 | 0.1 | 0.4 | 0.3 | 0.2 | 0.3 | ||
| 2010 | 0.0 | 0.6 | 0.5 | 0.8 | 0.6 | 1.0 | 0.4 | 0.1 | 0.2 | 0.1 | 0.5 | 0.1 | 0.2 | 0.7 | 0.7 | 0.2 | 0.5 | ||
| 2009 | 0.0 | 0.3 | 0.4 | 0.5 | 0.4 | 0.3 | 0.8 | 0.1 | 0.1 | 0.0 | 0.0 | 0.0 | 0.1 | 0.5 | 0.4 | 0.1 | 0.3 | ||
| 2008 | 0.0 | 0.2 | 0.9 | 0.4 | 0.3 | 0.4 | 0.5 | 0.3 | 0.1 | 0.0 | 0.1 | 0.0 | 0.0 | 0.5 | 0.4 | 0.1 | 0.3 | ||
| 2007 | 0.0 | 0.3 | 0.8 | 0.8 | 0.2 | 0.6 | 0.7 | 0.5 | 0.0 | 0.0 | 0.0 | 0.0 | 0.1 | 0.7 | 0.6 | 0.0 | 0.4 | ||
| 2006 | 0.0 | 0.0 | 0.6 | 0.4 | 0.1 | 0.3 | 10.8 | 1.9 | 0.2 | 0.1 | 0.0 | 0.0 | 0.0 | 0.4 | 4.5 | 0.1 | 1.1 | ||
| 2005 | 0.0 | 0.3 | 0.3 | 0.3 | 0.3 | 0.4 | 0.6 | 0.1 | 0.1 | 0.0 | 0.0 | 0.0 | 0.1 | 0.3 | 0.4 | 0.0 | 0.2 | ||
| 2004 | 0.0 | 0.0 | 0.3 | 0.2 | 0.3 | 0.2 | 0.9 | 0.0 | 0.0 | 0.0 | 0.0 | 0.0 | 0.0 | 0.3 | 0.4 | 0.0 | 0.2 | ||
| 2003 | 0.0 | 0.0 | 0.2 | 0.1 | 0.2 | 0.1 | 0.0 | 0.0 | 0.1 | 0.0 | 0.0 | 0.0 | 0.0 | 0.2 | 0.1 | 0.1 | 0.1 | ||
| 2002 | 0.0 | 0.1 | 0.1 | 0.3 | 0.2 | 0.4 | 0.2 | 0.1 | 0.1 | 0.1 | 0.3 | 0.0 | 0.0 | 0.2 | 0.3 | 0.1 | 0.2 | ||
| 2001 | 0.0 | 0.4 | 0.3 | 0.4 | 0.3 | 0.8 | 0.5 | 0.4 | 0.2 | 0.2 | 0.0 | 0.0 | 0.1 | 0.4 | 0.6 | 0.2 | 0.3 | ||
| 2000 | 0.0 | 0.2 | 0.1 | 0.4 | 0.7 | 0.2 | 0.4 | 0.3 | 0.0 | 0.1 | 0.0 | 0.0 | 0.1 | 0.4 | 0.3 | 0.1 | 0.2 | ||
| 1999 | 0.0 | 0.1 | 0.5 | 0.4 | 0.2 | 0.3 | 0.3 | 0.8 | 0.7 | 0.5 | 0.0 | 0.4 | 0.3 | 0.4 | 0.5 | 0.4 | 0.4 | ||
| 1998 | 0.0 | 0.1 | 0.2 | 0.1 | 0.4 | 0.1 | 0.2 | 0.2 | 0.0 | 0.0 | 0.0 | 0.0 | 0.0 | 0.3 | 0.2 | 0.0 | 0.1 | ||
| 1997 | 0.0 | 0.8 | 0.0 | 0.4 | 25.8 | 0.2 | 0.5 | 0.1 | 2.0 | 0.0 | 0.0 | 0.0 | 0.2 | 10.1 | 0.3 | 0.4 | 3.5 | ||
| 1996 | 0.0 | 0.2 | 0.3 | 0.5 | 0.2 | 0.1 | 0.5 | 0.4 | 0.0 | 0.0 | 0.1 | 0.0 | 0.1 | 0.3 | 0.3 | 0.0 | 0.2 | ||
| 1995 | 0.0 | 0.2 | 0.2 | 0.4 | 0.2 | 0.4 | 1.0 | 0.4 | 1.0 | 0.0 | 0.0 | 0.0 | 0.1 | 0.3 | 0.7 | 0.3 | 0.3 | ||
| 1994 | 0.0 | 0.2 | 0.6 | 0.1 | 0.2 | 0.4 | 1.3 | 0.6 | 0.0 | 0.2 | 0.0 | 0.0 | 0.1 | 0.3 | 0.8 | 0.1 | 0.3 | ||
| 1993 | 0.0 | 0.6 | 1.3 | 0.6 | 0.5 | 2.6 | 1.0 | 1.2 | 0.3 | 2.2 | 0.1 | 0.0 | 0.2 | 0.8 | 1.6 | 0.7 | 0.8 | ||
| 1992 | 0.1 | 0.2 | 2.5 | 0.3 | 0.7 | 0.8 | 0.3 | 1.5 | 1.9 | 0.2 | 0.0 | 0.0 | 0.1 | 1.2 | 0.8 | 0.7 | 0.7 | ||
| 1991 | 0.1 | 0.7 | 0.6 | 0.7 | 0.5 | 0.6 | 1.0 | 0.9 | 1.1 | 0.0 | 0.0 | 0.0 | 0.3 | 0.6 | 0.8 | 0.4 | 0.5 | ||
| 1990 | 0.1 | 0.3 | 0.4 | 0.5 | 0.1 | 0.6 | 0.5 | 0.6 | 0.5 | 0.4 | 0.2 | 0.1 | 0.2 | 0.3 | 0.6 | 0.4 | 0.3 | ||
| 1989 | 0.1 | 0.1 | 0.1 | 0.4 | 0.2 | 0.2 | 0.2 | 0.2 | 0.1 | 0.1 | 0.1 | 0.0 | 0.1 | 0.2 | 0.2 | 0.1 | 0.2 | ||
| 1988 | 0.0 | 0.1 | 0.1 | 0.1 | 0.1 | 0.1 | 0.1 | 0.2 | 0.0 | 0.0 | 0.0 | 0.0 | 0.0 | 0.1 | 0.1 | 0.0 | 0.1 | ||
| 1987 | 0.0 | 0.1 | 0.1 | 0.1 | 0.1 | 0.1 | 0.3 | 0.1 | 0.1 | 0.0 | 0.0 | 0.0 | 0.0 | 0.1 | 0.2 | 0.0 | 0.1 | ||
| 1986 | 0.0 | 0.1 | 0.1 | 0.9 | 0.0 | 0.9 | 0.5 | 0.2 | 1.2 | 0.0 | 0.0 | 0.0 | 0.0 | 0.3 | 0.5 | 0.3 | 0.3 | ||
| 1985 | 0.1 | 0.3 | 0.3 | 0.5 | 0.0 | 0.0 | 1.2 | 12.1 | 0.0 | 0.1 | 0.0 | 0.0 | 0.1 | 0.3 | 2.5 | 0.0 | 0.7 | ||
| 1984 | 0.0 | 0.0 | 0.0 | 0.0 | 0.0 | 0.0 | 0.1 | 0.0 | 0.1 | 0.0 | 0.0 | 0.0 | 0.0 | 0.0 | 0.1 | 0.0 | 0.0 | ||
| 1983 | 0.0 | 0.1 | 0.0 | 0.0 | 0.0 | 0.0 | 0.0 | 0.0 | 0.0 | - | 0.0 | 0.0 | 0.0 | 0.0 | 0.0 | 0.0 | 0.0 | ||
| 1982 | - | 0.0 | - | 0.0 | 0.0 | 0.0 | - | 0.0 | - | 0.0 | - | 0.0 | 0.0 | 0.0 | 0.0 | 0.0 | 0.0 | ||
Reporting rates
Reporting rate is the proportion of all surveys in which the species was present.
Reporting rate by year
This chart shows the reporting rate of Tree Martin each year between 1982 and 2017. 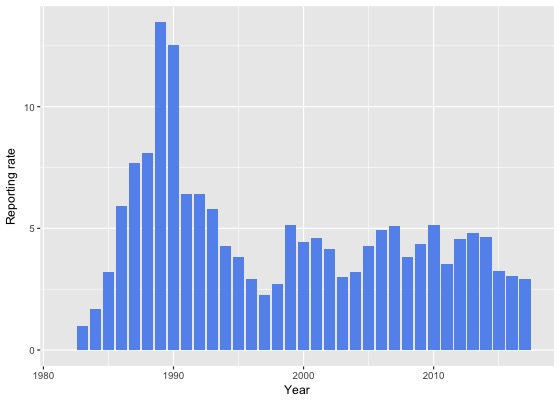
Reporting rate by month
This chart shows the reporting rate by month of Tree Martin. The blue lines show the reporting rate for the twelve months to June 2017 and the bars show the average reporting rate for the period 1982 to 2017. 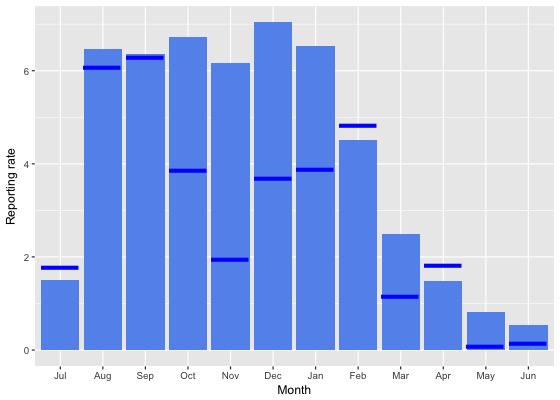
Reporting rate by season
This chart shows the seasonal reporting rate of Tree Martin. The blue lines show the seasonal reporting rate for the twelve months to June 2017 and the bars show the average seasonal reporting rate for the period 1982 to 2017. 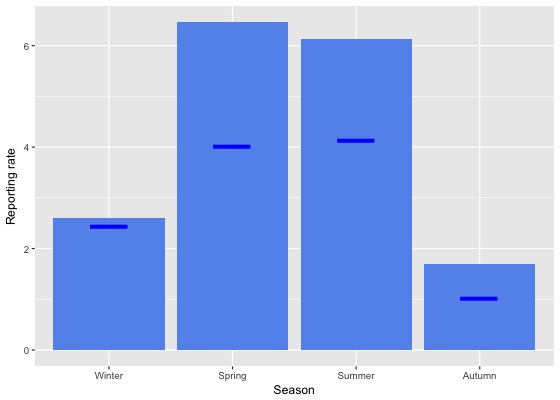
Reporting rate data
| Month | Season | ||||||||||||||||||
|---|---|---|---|---|---|---|---|---|---|---|---|---|---|---|---|---|---|---|---|
| Period | Jul | Aug | Sep | Oct | Nov | Dec | Jan | Feb | Mar | Apr | May | Jun | Winter | Spring | Summer | Autumn | All | ||
| All years | |||||||||||||||||||
| All | 1.5 | 6.5 | 6.4 | 6.7 | 6.2 | 7.0 | 6.5 | 4.5 | 2.5 | 1.5 | 0.8 | 0.5 | 2.6 | 6.5 | 6.1 | 1.7 | 4.4 | ||
| Previous years | |||||||||||||||||||
| All previous years | 1.5 | 6.5 | 6.4 | 7.1 | 6.8 | 7.5 | 7.0 | 4.4 | 2.7 | 1.4 | 1.0 | 0.6 | 2.6 | 6.8 | 6.5 | 1.8 | 4.7 | ||
| Previous 30 years | 1.4 | 6.6 | 6.4 | 7.1 | 6.9 | 7.6 | 7.0 | 4.4 | 2.7 | 1.4 | 1.0 | 0.6 | 2.6 | 6.9 | 6.5 | 1.8 | 4.7 | ||
| Previous 20 years | 0.8 | 5.2 | 5.8 | 6.5 | 6.0 | 6.8 | 5.9 | 3.2 | 2.0 | 1.0 | 0.9 | 0.5 | 1.9 | 6.1 | 5.5 | 1.4 | 4.0 | ||
| 10 year groups | |||||||||||||||||||
| [2007,2017) | 1.0 | 5.8 | 5.6 | 6.1 | 6.0 | 6.4 | 5.8 | 3.1 | 1.9 | 1.0 | 1.0 | 0.7 | 2.2 | 5.9 | 5.2 | 1.3 | 3.9 | ||
| [1997,2007) | 0.4 | 4.0 | 6.1 | 7.6 | 6.2 | 7.8 | 6.4 | 3.3 | 2.2 | 0.9 | 0.8 | 0.2 | 1.3 | 6.7 | 6.2 | 1.4 | 4.1 | ||
| [1987,1997) | 3.7 | 10.7 | 9.7 | 11.0 | 9.9 | 11.8 | 13.6 | 10.2 | 6.7 | 3.7 | 1.2 | 1.1 | 5.4 | 10.2 | 11.9 | 3.9 | 8.0 | ||
| 5 year groups | |||||||||||||||||||
| [2012,2017) | 0.9 | 6.0 | 5.1 | 5.7 | 5.8 | 6.2 | 6.0 | 2.8 | 1.8 | 0.9 | 0.7 | 0.6 | 2.4 | 5.5 | 5.1 | 1.2 | 3.8 | ||
| [2007,2012) | 1.2 | 5.0 | 6.8 | 6.9 | 6.5 | 6.7 | 4.9 | 4.2 | 2.1 | 1.2 | 1.9 | 0.8 | 1.8 | 6.8 | 5.5 | 1.7 | 4.3 | ||
| [2002,2007) | 0.5 | 3.6 | 6.8 | 7.6 | 5.1 | 7.9 | 6.2 | 3.0 | 2.0 | 0.6 | 0.9 | 0.1 | 1.1 | 6.6 | 6.2 | 1.3 | 4.0 | ||
| [1997,2002) | 0.4 | 4.6 | 5.2 | 7.7 | 7.5 | 7.5 | 6.6 | 3.7 | 2.5 | 1.3 | 0.6 | 0.3 | 1.6 | 6.7 | 6.1 | 1.6 | 4.2 | ||
| [1992,1997) | 1.2 | 4.6 | 8.4 | 5.6 | 6.1 | 4.7 | 7.9 | 6.1 | 4.3 | 3.0 | 0.5 | 0.0 | 2.1 | 6.6 | 6.3 | 2.7 | 4.5 | ||
| [1987,1992) | 4.9 | 14.0 | 10.3 | 13.9 | 11.8 | 15.0 | 16.8 | 11.8 | 8.1 | 4.2 | 1.5 | 1.7 | 7.1 | 12.1 | 14.5 | 4.6 | 9.7 | ||
| Year | |||||||||||||||||||
| 2017 | 1.8 | 6.1 | 6.3 | 3.9 | 2.0 | 3.7 | 3.9 | 4.8 | 1.1 | 1.8 | 0.1 | 0.2 | 2.4 | 4.0 | 4.1 | 1.0 | 2.9 | ||
| 2016 | 0.5 | 6.1 | 4.9 | 4.8 | 4.2 | 4.3 | 3.9 | 2.8 | 2.0 | 0.8 | 0.8 | 0.5 | 2.6 | 4.7 | 3.6 | 1.2 | 3.0 | ||
| 2015 | 0.5 | 3.1 | 4.1 | 6.3 | 4.3 | 5.3 | 5.6 | 2.8 | 1.6 | 0.8 | 0.7 | 0.8 | 1.4 | 5.1 | 4.7 | 1.1 | 3.3 | ||
| 2014 | 2.4 | 5.9 | 6.0 | 5.0 | 7.8 | 8.5 | 10.7 | 3.1 | 1.4 | 0.5 | 0.4 | 0.0 | 2.3 | 5.9 | 8.0 | 0.9 | 4.7 | ||
| 2013 | 0.9 | 10.0 | 5.0 | 7.0 | 10.5 | 7.7 | 6.6 | 1.8 | 1.6 | 0.7 | 0.4 | 0.7 | 3.6 | 7.4 | 5.9 | 1.0 | 4.8 | ||
| 2012 | 1.6 | 7.1 | 6.4 | 6.1 | 5.5 | 8.4 | 4.4 | 4.4 | 3.0 | 2.2 | 0.5 | 0.9 | 3.0 | 6.0 | 5.7 | 2.1 | 4.6 | ||
| 2011 | 1.6 | 1.6 | 4.3 | 7.9 | 3.6 | 5.1 | 3.0 | 3.2 | 1.9 | 2.8 | 1.8 | 0.9 | 1.2 | 6.1 | 3.8 | 2.2 | 3.5 | ||
| 2010 | 0.0 | 8.8 | 9.0 | 8.0 | 6.2 | 9.1 | 3.4 | 2.4 | 2.0 | 1.3 | 2.9 | 1.1 | 2.8 | 7.9 | 6.0 | 1.9 | 5.2 | ||
| 2009 | 1.4 | 6.2 | 6.0 | 5.5 | 5.8 | 7.9 | 8.7 | 3.3 | 3.7 | 0.8 | 1.5 | 0.0 | 1.8 | 5.7 | 7.0 | 2.0 | 4.4 | ||
| 2008 | 0.0 | 4.3 | 8.2 | 4.0 | 7.4 | 5.4 | 6.3 | 5.6 | 2.7 | 0.6 | 2.7 | 0.0 | 1.1 | 5.6 | 5.7 | 1.6 | 3.8 | ||
| 2007 | 3.3 | 4.6 | 6.2 | 10.0 | 10.1 | 6.4 | 5.9 | 7.0 | 0.9 | 0.0 | 0.8 | 1.6 | 2.6 | 8.9 | 6.3 | 0.5 | 5.1 | ||
| 2006 | 0.0 | 4.9 | 7.5 | 6.9 | 3.0 | 8.9 | 14.6 | 8.9 | 3.2 | 0.5 | 0.0 | 0.4 | 1.2 | 6.2 | 11.0 | 1.8 | 4.9 | ||
| 2005 | 0.7 | 3.7 | 7.1 | 9.9 | 6.9 | 10.4 | 6.4 | 2.2 | 0.9 | 0.5 | 1.0 | 0.0 | 1.0 | 7.9 | 7.6 | 0.8 | 4.3 | ||
| 2004 | 0.8 | 2.6 | 7.7 | 9.3 | 4.1 | 6.0 | 3.0 | 1.0 | 0.5 | 0.5 | 1.0 | 0.0 | 1.1 | 7.1 | 4.0 | 0.6 | 3.2 | ||
| 2003 | 0.0 | 2.2 | 6.8 | 4.7 | 6.0 | 5.9 | 1.5 | 1.1 | 1.8 | 0.9 | 0.8 | 0.0 | 0.7 | 5.9 | 3.3 | 1.2 | 3.0 | ||
| 2002 | 0.6 | 5.1 | 5.0 | 8.2 | 5.5 | 8.3 | 3.8 | 2.0 | 2.7 | 0.6 | 2.4 | 0.0 | 1.5 | 6.3 | 5.7 | 1.9 | 4.2 | ||
| 2001 | 0.4 | 1.8 | 5.3 | 5.9 | 9.1 | 15.6 | 6.0 | 3.1 | 2.7 | 1.0 | 0.6 | 0.0 | 0.7 | 6.4 | 9.1 | 1.7 | 4.6 | ||
| 2000 | 0.0 | 4.6 | 5.1 | 10.1 | 10.2 | 3.7 | 6.6 | 4.3 | 2.0 | 1.8 | 0.9 | 0.0 | 1.5 | 8.5 | 4.8 | 1.7 | 4.4 | ||
| 1999 | 0.0 | 7.2 | 10.9 | 10.1 | 7.1 | 7.5 | 8.0 | 3.6 | 3.2 | 2.1 | 0.6 | 0.9 | 2.6 | 9.4 | 6.4 | 2.0 | 5.2 | ||
| 1998 | 0.0 | 5.7 | 1.6 | 2.2 | 5.3 | 2.8 | 5.9 | 5.7 | 1.1 | 0.0 | 0.0 | 0.0 | 1.8 | 3.0 | 4.4 | 0.6 | 2.7 | ||
| 1997 | 1.1 | 6.9 | 0.0 | 7.9 | 2.6 | 1.9 | 5.9 | 1.8 | 2.5 | 0.0 | 0.0 | 0.0 | 2.3 | 3.0 | 2.8 | 0.5 | 2.3 | ||
| 1996 | 0.0 | 3.2 | 4.0 | 4.4 | 4.6 | 3.0 | 5.8 | 2.4 | 2.9 | 0.0 | 1.7 | 0.0 | 1.2 | 4.4 | 3.8 | 1.8 | 2.9 | ||
| 1995 | 0.0 | 5.4 | 2.9 | 6.1 | 4.5 | 2.3 | 8.0 | 6.3 | 7.1 | 0.8 | 0.0 | 0.0 | 2.2 | 4.8 | 5.7 | 2.7 | 3.8 | ||
| 1994 | 0.0 | 5.2 | 8.8 | 3.5 | 5.9 | 4.3 | 11.8 | 8.6 | 1.1 | 3.8 | 0.0 | 0.0 | 1.8 | 5.9 | 8.7 | 2.0 | 4.3 | ||
| 1993 | 0.0 | 5.1 | 11.3 | 8.0 | 4.5 | 10.9 | 12.2 | 12.5 | 4.9 | 5.0 | 1.3 | 0.0 | 2.0 | 7.9 | 11.8 | 3.7 | 5.8 | ||
| 1992 | 6.2 | 3.7 | 16.5 | 6.4 | 12.5 | 6.3 | 3.4 | 4.9 | 5.6 | 6.8 | 0.0 | 0.0 | 3.4 | 11.6 | 4.9 | 3.9 | 6.4 | ||
| 1991 | 3.9 | 8.5 | 7.0 | 8.7 | 6.2 | 6.8 | 14.3 | 10.0 | 9.5 | 0.0 | 1.6 | 0.0 | 4.8 | 7.3 | 10.0 | 3.8 | 6.4 | ||
| 1990 | 7.7 | 20.5 | 14.0 | 18.4 | 10.3 | 23.6 | 19.4 | 11.3 | 8.0 | 4.8 | 2.7 | 3.9 | 12.7 | 14.1 | 18.1 | 5.3 | 12.5 | ||
| 1989 | 8.2 | 14.7 | 13.5 | 20.0 | 19.7 | 20.4 | 20.2 | 14.9 | 9.4 | 7.2 | 2.6 | 3.0 | 9.2 | 17.8 | 18.6 | 6.6 | 13.5 | ||
| 1988 | 0.9 | 10.8 | 12.4 | 10.9 | 12.5 | 11.3 | 14.1 | 10.9 | 4.5 | 4.3 | 2.0 | 1.0 | 4.7 | 11.9 | 12.1 | 3.6 | 8.1 | ||
| 1987 | 0.0 | 13.3 | 5.7 | 10.9 | 8.7 | 12.3 | 15.9 | 10.4 | 10.0 | 2.5 | 0.0 | 1.0 | 1.7 | 8.5 | 12.7 | 4.0 | 7.7 | ||
| 1986 | 0.0 | 2.6 | 7.5 | 16.7 | 2.1 | 17.6 | 13.0 | 8.3 | 6.5 | 0.0 | 0.0 | 0.0 | 1.0 | 8.1 | 12.9 | 1.8 | 5.9 | ||
| 1985 | 6.7 | 6.7 | 1.9 | 2.3 | 0.0 | 0.0 | 12.5 | 17.6 | 0.0 | 10.5 | 0.0 | 0.0 | 4.5 | 1.5 | 4.7 | 5.0 | 3.2 | ||
| 1984 | 0.0 | 0.0 | 0.0 | 0.0 | 0.0 | 0.0 | 3.4 | 3.0 | 3.7 | 0.0 | 3.2 | 0.0 | 0.0 | 0.0 | 2.7 | 2.2 | 1.7 | ||
| 1983 | 0.0 | 8.3 | 0.0 | 0.0 | 0.0 | 0.0 | 0.0 | 0.0 | 0.0 | - | 0.0 | 0.0 | 3.4 | 0.0 | 0.0 | 0.0 | 1.0 | ||
| 1982 | - | 0.0 | - | 0.0 | 0.0 | 0.0 | - | 0.0 | - | 0.0 | - | 0.0 | 0.0 | 0.0 | 0.0 | 0.0 | 0.0 | ||
Breeding data
Breeding records by month
Number of breeding records by breeding code and month, 2017 and all years| Breeding code | Jul | Aug | Sep | Oct | Nov | Dec | Jan | Feb | Mar | Apr | May | Jun |
|---|---|---|---|---|---|---|---|---|---|---|---|---|
| 2017 | ||||||||||||
| Breeding (BLA code) | 0 | 0 | 0 | 0 | 1 | 0 | 0 | 0 | 0 | 0 | 0 | 0 |
| Carrying Food | 0 | 0 | 0 | 0 | 0 | 0 | 0 | 0 | 0 | 0 | 0 | 0 |
| Copulating | 0 | 0 | 0 | 0 | 0 | 0 | 0 | 0 | 0 | 0 | 0 | 0 |
| Display | 0 | 0 | 0 | 0 | 0 | 0 | 0 | 0 | 0 | 0 | 0 | 0 |
| Dependent young | 0 | 0 | 0 | 0 | 0 | 0 | 0 | 0 | 0 | 0 | 0 | 0 |
| Faecal sac | 0 | 0 | 0 | 0 | 0 | 0 | 0 | 0 | 0 | 0 | 0 | 0 |
| Inspecting hollow | 0 | 0 | 0 | 1 | 2 | 0 | 0 | 0 | 0 | 0 | 0 | 0 |
| Nest building | 0 | 0 | 0 | 0 | 0 | 0 | 0 | 0 | 0 | 0 | 0 | 0 |
| Nest with eggs | 0 | 0 | 0 | 0 | 0 | 0 | 0 | 0 | 0 | 0 | 0 | 0 |
| Nest with young | 0 | 0 | 0 | 0 | 0 | 0 | 0 | 0 | 0 | 0 | 0 | 0 |
| On/leaving nest | 0 | 0 | 0 | 3 | 0 | 0 | 0 | 0 | 0 | 0 | 0 | 0 |
| All years | ||||||||||||
| Breeding (BLA code) | 0 | 0 | 0 | 0 | 6 | 0 | 1 | 0 | 0 | 0 | 0 | 0 |
| Carrying Food | 0 | 0 | 2 | 3 | 4 | 2 | 2 | 0 | 0 | 0 | 0 | 0 |
| Copulating | 0 | 0 | 0 | 0 | 0 | 0 | 0 | 0 | 0 | 0 | 0 | 0 |
| Display | 0 | 0 | 0 | 0 | 0 | 0 | 0 | 0 | 0 | 0 | 0 | 0 |
| Dependent young | 0 | 0 | 0 | 0 | 4 | 4 | 9 | 7 | 0 | 1 | 0 | 0 |
| Faecal sac | 0 | 0 | 0 | 0 | 0 | 0 | 1 | 0 | 0 | 0 | 0 | 0 |
| Inspecting hollow | 0 | 2 | 10 | 27 | 15 | 10 | 1 | 0 | 0 | 1 | 0 | 0 |
| Nest building | 0 | 1 | 12 | 14 | 5 | 7 | 5 | 1 | 0 | 0 | 0 | 0 |
| Nest with eggs | 0 | 0 | 0 | 2 | 2 | 1 | 0 | 0 | 0 | 0 | 0 | 0 |
| Nest with young | 0 | 0 | 0 | 5 | 8 | 2 | 6 | 0 | 0 | 0 | 0 | 0 |
| On/leaving nest | 0 | 0 | 2 | 26 | 10 | 2 | 1 | 0 | 0 | 0 | 0 | 0 |
Breeding records by year
Average number of breeding records per period by breeding code| Period | Breeding (BLA code) | Carrying Food | Copulating | Display | Dependent young | Faecal sac | Inspecting hollow | Nest building | Nest with eggs | Nest with young | On/leaving nest |
|---|---|---|---|---|---|---|---|---|---|---|---|
| All years | |||||||||||
| All | 0.2 | 0.4 | 0.0 | 0.0 | 0.7 | 0.0 | 1.8 | 1.2 | 0.1 | 0.6 | 1.1 |
| Previous years | |||||||||||
| All previous years | 0.2 | 0.4 | 0.0 | 0.0 | 0.7 | 0.0 | 1.8 | 1.3 | 0.1 | 0.6 | 1.1 |
| Previous 30 years | 0.2 | 0.4 | 0.0 | 0.0 | 0.8 | 0.0 | 2.1 | 1.5 | 0.2 | 0.7 | 1.3 |
| Previous 20 years | 0.3 | 0.1 | 0.0 | 0.0 | 0.5 | 0.0 | 3.0 | 0.5 | 0.0 | 0.3 | 1.8 |
| 10 year groups | |||||||||||
| [2007,2017) | 0.2 | 0.2 | 0.0 | 0.0 | 0.8 | 0.1 | 3.7 | 0.7 | 0.0 | 0.5 | 2.9 |
| [1997,2007) | 0.4 | 0.1 | 0.0 | 0.0 | 0.2 | 0.0 | 2.2 | 0.3 | 0.0 | 0.2 | 0.7 |
| [1987,1997) | 0.0 | 1.0 | 0.0 | 0.0 | 1.5 | 0.0 | 0.4 | 3.4 | 0.5 | 1.4 | 0.2 |
| 5 year groups | |||||||||||
| [2012,2017) | 0.2 | 0.0 | 0.0 | 0.0 | 1.2 | 0.2 | 3.6 | 0.6 | 0.0 | 0.8 | 3.2 |
| [2007,2012) | 0.2 | 0.4 | 0.0 | 0.0 | 0.4 | 0.0 | 3.8 | 0.8 | 0.0 | 0.2 | 2.6 |
| [2002,2007) | 0.2 | 0.2 | 0.0 | 0.0 | 0.2 | 0.0 | 3.2 | 0.4 | 0.0 | 0.2 | 0.8 |
| [1997,2002) | 0.6 | 0.0 | 0.0 | 0.0 | 0.2 | 0.0 | 1.2 | 0.2 | 0.0 | 0.2 | 0.6 |
| [1992,1997) | 0.0 | 0.2 | 0.0 | 0.0 | 0.4 | 0.0 | 0.6 | 0.2 | 0.0 | 0.0 | 0.4 |
| [1987,1992) | 0.0 | 1.8 | 0.0 | 0.0 | 2.6 | 0.0 | 0.2 | 6.6 | 1.0 | 2.8 | 0.0 |
| Year | |||||||||||
| 2017 | 1.0 | 0.0 | 0.0 | 0.0 | 0.0 | 0.0 | 3.0 | 0.0 | 0.0 | 0.0 | 3.0 |
| 2016 | 0.0 | 0.0 | 0.0 | 0.0 | 0.0 | 0.0 | 3.0 | 0.0 | 0.0 | 0.0 | 3.0 |
| 2015 | 0.0 | 0.0 | 0.0 | 0.0 | 0.0 | 0.0 | 5.0 | 1.0 | 0.0 | 2.0 | 2.0 |
| 2014 | 0.0 | 0.0 | 0.0 | 0.0 | 3.0 | 0.0 | 3.0 | 1.0 | 0.0 | 0.0 | 4.0 |
| 2013 | 1.0 | 0.0 | 0.0 | 0.0 | 1.0 | 0.0 | 4.0 | 1.0 | 0.0 | 1.0 | 6.0 |
| 2012 | 0.0 | 0.0 | 0.0 | 0.0 | 2.0 | 1.0 | 3.0 | 0.0 | 0.0 | 1.0 | 1.0 |
| 2011 | 0.0 | 0.0 | 0.0 | 0.0 | 0.0 | 0.0 | 5.0 | 0.0 | 0.0 | 0.0 | 1.0 |
| 2010 | 0.0 | 1.0 | 0.0 | 0.0 | 1.0 | 0.0 | 6.0 | 0.0 | 0.0 | 1.0 | 7.0 |
| 2009 | 1.0 | 0.0 | 0.0 | 0.0 | 0.0 | 0.0 | 8.0 | 1.0 | 0.0 | 0.0 | 2.0 |
| 2008 | 0.0 | 1.0 | 0.0 | 0.0 | 0.0 | 0.0 | 0.0 | 2.0 | 0.0 | 0.0 | 2.0 |
| 2007 | 0.0 | 0.0 | 0.0 | 0.0 | 1.0 | 0.0 | 0.0 | 1.0 | 0.0 | 0.0 | 1.0 |
| 2006 | 0.0 | 1.0 | 0.0 | 0.0 | 0.0 | 0.0 | 4.0 | 1.0 | 0.0 | 0.0 | 2.0 |
| 2005 | 0.0 | 0.0 | 0.0 | 0.0 | 0.0 | 0.0 | 7.0 | 1.0 | 0.0 | 0.0 | 1.0 |
| 2004 | 0.0 | 0.0 | 0.0 | 0.0 | 0.0 | 0.0 | 4.0 | 0.0 | 0.0 | 0.0 | 0.0 |
| 2003 | 1.0 | 0.0 | 0.0 | 0.0 | 1.0 | 0.0 | 0.0 | 0.0 | 0.0 | 0.0 | 0.0 |
| 2002 | 0.0 | 0.0 | 0.0 | 0.0 | 0.0 | 0.0 | 1.0 | 0.0 | 0.0 | 1.0 | 1.0 |
| 2001 | 2.0 | 0.0 | 0.0 | 0.0 | 0.0 | 0.0 | 0.0 | 0.0 | 0.0 | 0.0 | 1.0 |
| 2000 | 1.0 | 0.0 | 0.0 | 0.0 | 0.0 | 0.0 | 0.0 | 1.0 | 0.0 | 1.0 | 0.0 |
| 1999 | 0.0 | 0.0 | 0.0 | 0.0 | 0.0 | 0.0 | 4.0 | 0.0 | 0.0 | 0.0 | 0.0 |
| 1998 | 0.0 | 0.0 | 0.0 | 0.0 | 1.0 | 0.0 | 1.0 | 0.0 | 0.0 | 0.0 | 1.0 |
| 1997 | 0.0 | 0.0 | 0.0 | 0.0 | 0.0 | 0.0 | 1.0 | 0.0 | 0.0 | 0.0 | 1.0 |
| 1996 | 0.0 | 0.0 | 0.0 | 0.0 | 0.0 | 0.0 | 0.0 | 0.0 | 0.0 | 0.0 | 2.0 |
| 1995 | 0.0 | 0.0 | 0.0 | 0.0 | 1.0 | 0.0 | 1.0 | 0.0 | 0.0 | 0.0 | 0.0 |
| 1994 | 0.0 | 0.0 | 0.0 | 0.0 | 1.0 | 0.0 | 0.0 | 1.0 | 0.0 | 0.0 | 0.0 |
| 1993 | 0.0 | 0.0 | 0.0 | 0.0 | 0.0 | 0.0 | 1.0 | 0.0 | 0.0 | 0.0 | 0.0 |
| 1992 | 0.0 | 1.0 | 0.0 | 0.0 | 0.0 | 0.0 | 1.0 | 0.0 | 0.0 | 0.0 | 0.0 |
| 1991 | 0.0 | 0.0 | 0.0 | 0.0 | 0.0 | 0.0 | 1.0 | 0.0 | 0.0 | 1.0 | 0.0 |
| 1990 | 0.0 | 1.0 | 0.0 | 0.0 | 0.0 | 0.0 | 0.0 | 1.0 | 0.0 | 0.0 | 0.0 |
| 1989 | 0.0 | 7.0 | 0.0 | 0.0 | 4.0 | 0.0 | 0.0 | 12.0 | 0.0 | 7.0 | 0.0 |
| 1988 | 0.0 | 1.0 | 0.0 | 0.0 | 6.0 | 0.0 | 0.0 | 11.0 | 0.0 | 3.0 | 0.0 |
| 1987 | 0.0 | 0.0 | 0.0 | 0.0 | 3.0 | 0.0 | 0.0 | 9.0 | 5.0 | 3.0 | 0.0 |
| 1986 | 0.0 | 0.0 | 0.0 | 0.0 | 0.0 | 0.0 | 0.0 | 1.0 | 0.0 | 0.0 | 0.0 |
| 1985 | 0.0 | 0.0 | 0.0 | 0.0 | 0.0 | 0.0 | 0.0 | 0.0 | 0.0 | 0.0 | 0.0 |
| 1984 | 0.0 | 0.0 | 0.0 | 0.0 | 0.0 | 0.0 | 0.0 | 0.0 | 0.0 | 0.0 | 0.0 |
| 1983 | 0.0 | 0.0 | 0.0 | 0.0 | 0.0 | 0.0 | 0.0 | 0.0 | 0.0 | 0.0 | 0.0 |
| 1982 | 0.0 | 0.0 | 0.0 | 0.0 | 0.0 | 0.0 | 0.0 | 0.0 | 0.0 | 0.0 | 0.0 |
Distribution map
Distribution - 2017
This map shows the observed distribution of the Tree Martin for 2017.
The red circles are the grid cells where Tree Martin have been reported.
The transparency of the red circles indicate how many surveys sheets were submitted for that grid cell; the darker the red the more reliable the data. Of the 315 grid cells with reports, 83 had only one sheet; an example is grid number Q30.
The size of the circle represents the reporting rate. The maximum reporting rate for Tree Martin was 100.0% (eg grid number Q30) and the minimum was 0.2% (eg grid number K14). 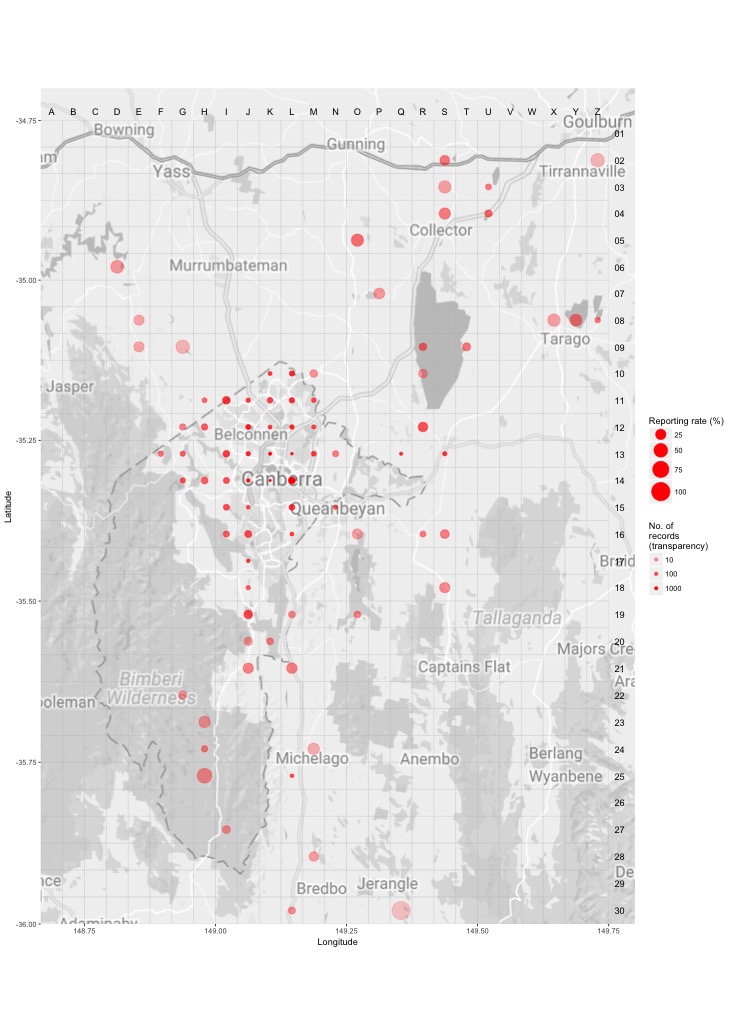
Distribution - all years
This map shows the observed distribution of the Tree Martin for all years.
The red circles are the grid cells where Tree Martin have been reported.
The transparency of the red circles indicate how many surveys sheets were submitted for that grid cell; the darker the red the more reliable the data. Of the 703 grid cells with reports, 55 had only one sheet; an example is grid number A12.
The size of the circle represents the reporting rate. The maximum reporting rate for Tree Martin was 50.0% (eg grid number B28) and the minimum was 0.3% (eg grid number Q16). 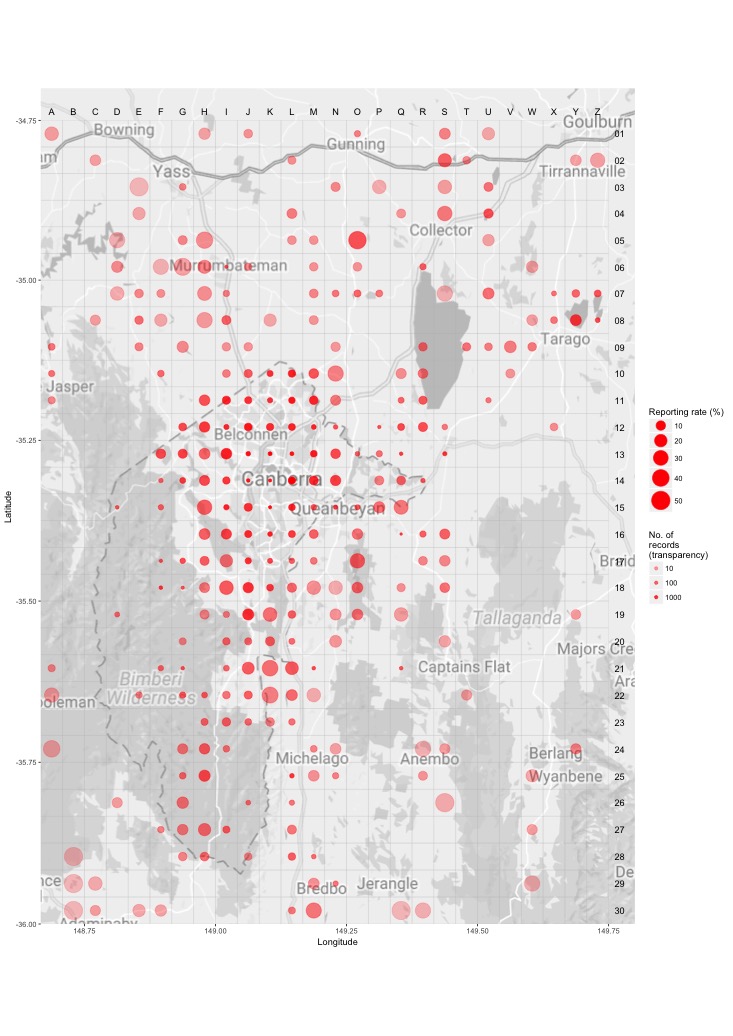
Breeding map
Breeding - 2017
This map shows the breeding distribution of the Tree Martin for 2017.
The red circles are the grid cells where breeding activity for Tree Martin have been reported.
The size of the circle represents the number of reports. 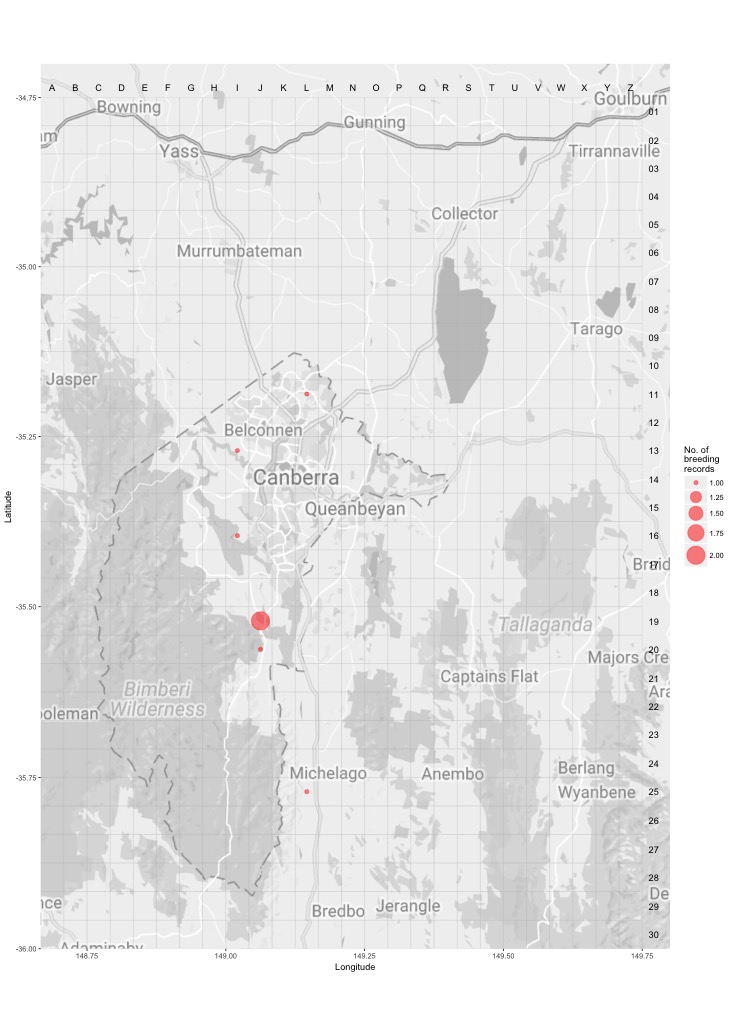
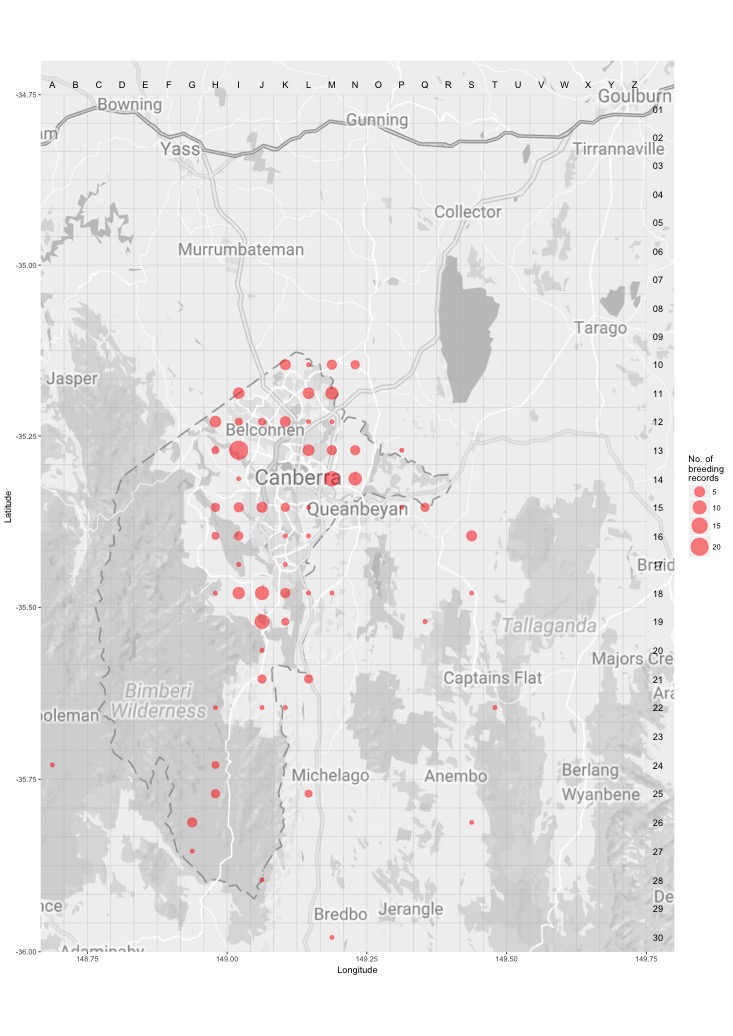
Breeding - all years
This map shows the breeding distribution of the Tree Martin for all years.
The red circles are the grid cells where breeding activity for Tree Martin have been reported.
The size of the circle represents the number of reports.